Providing you with a snapshot of what happened in the Property Market last month
Welcome to our Property Market Pulse, your go-to source for the latest updates and trends in the property market across Oadby, Wigston, and Clarendon Park, The Knighton’s & Stoneygate.
Whether you’re a homeowner, buyer, or investor, we provide insights into current market conditions, price movements, and local developments that could impact property values in your area. Stay informed with up-to-date information on sales, lettings, and the demand for homes, helping you make confident decisions in the ever-changing property landscape.
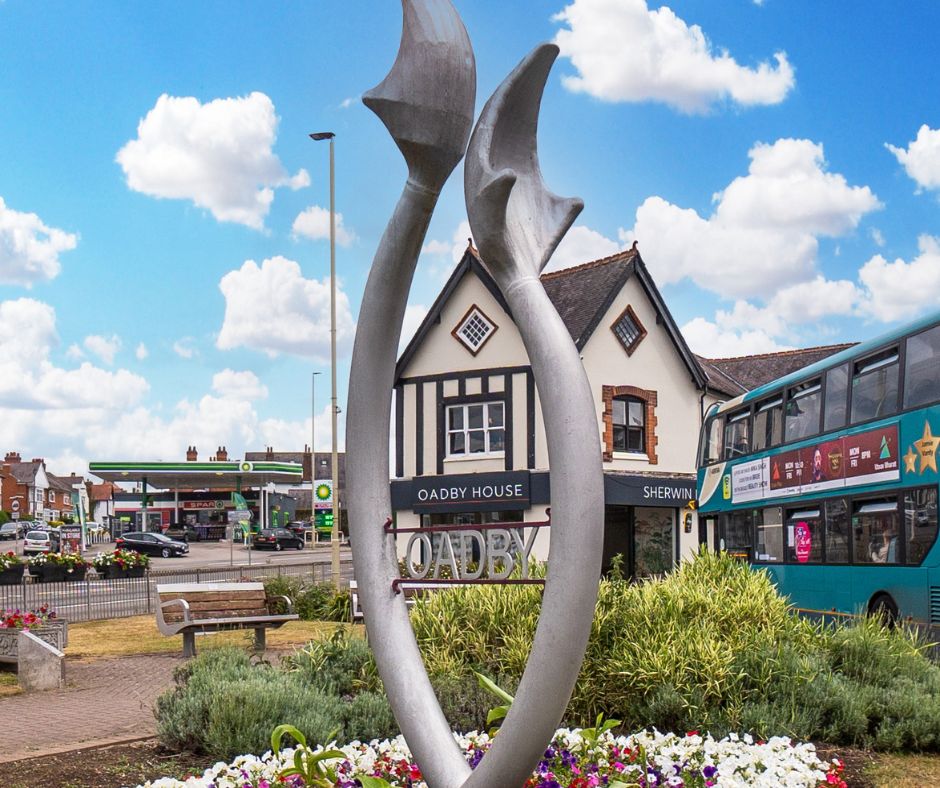
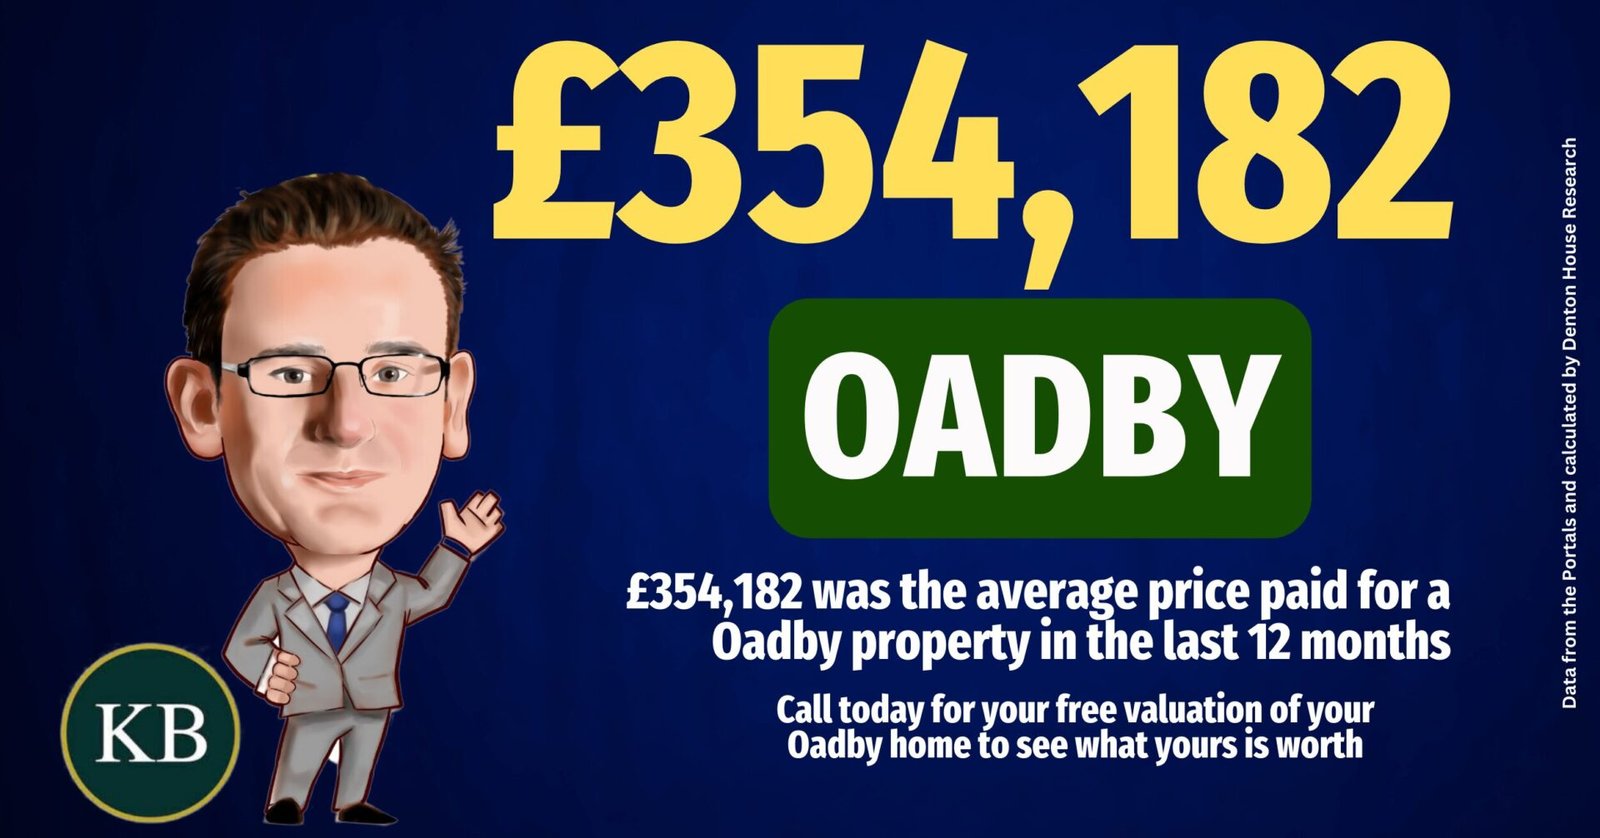
The Oadby property market (LE2 4 & LE2 5) continues to demonstrate solid activity, with 61 new instructions and 36 properties sold subject to contract. A total of 52 properties saw price changes, and 16 were withdrawn from the market—highlighting a market adjusting to ongoing demand and pricing dynamics. Year-on-year figures from 2024 to 2025 show a stable level of transactions, with consistent trends in sales agreed, withdrawals, and price changes. The average property price in Oadby over the past 12 months was £354,182, underlining the area’s strong position in the local market.
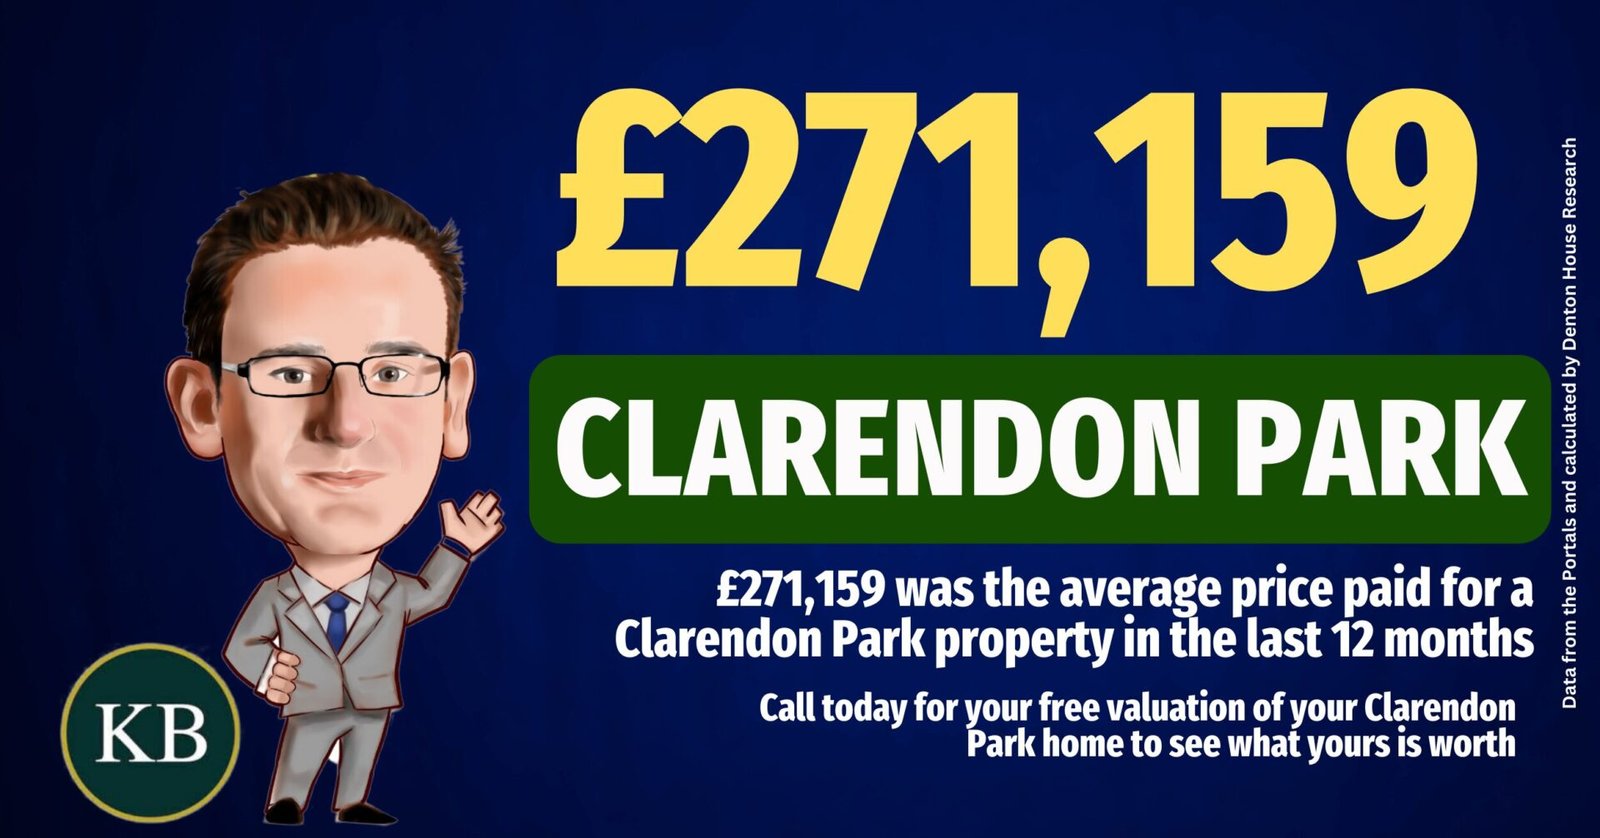
The Clarendon Park, Knighton’s & Stoneygate market (LE2 1, LE2 2 & LE2 3) remains vibrant in March 2025, with 75 new properties coming to the market and 42 sales agreed. There were 31 price changes recorded and 16 properties withdrawn, suggesting ongoing market fluidity. The comparison between 2024 and 2025 shows steady performance across all key metrics, including consistent sales activity and a balance in cancelled and withdrawn listings. The average property price in Clarendon Park over the past 12 months stands at £271,159—reflecting continued buyer demand in this sought-after area.
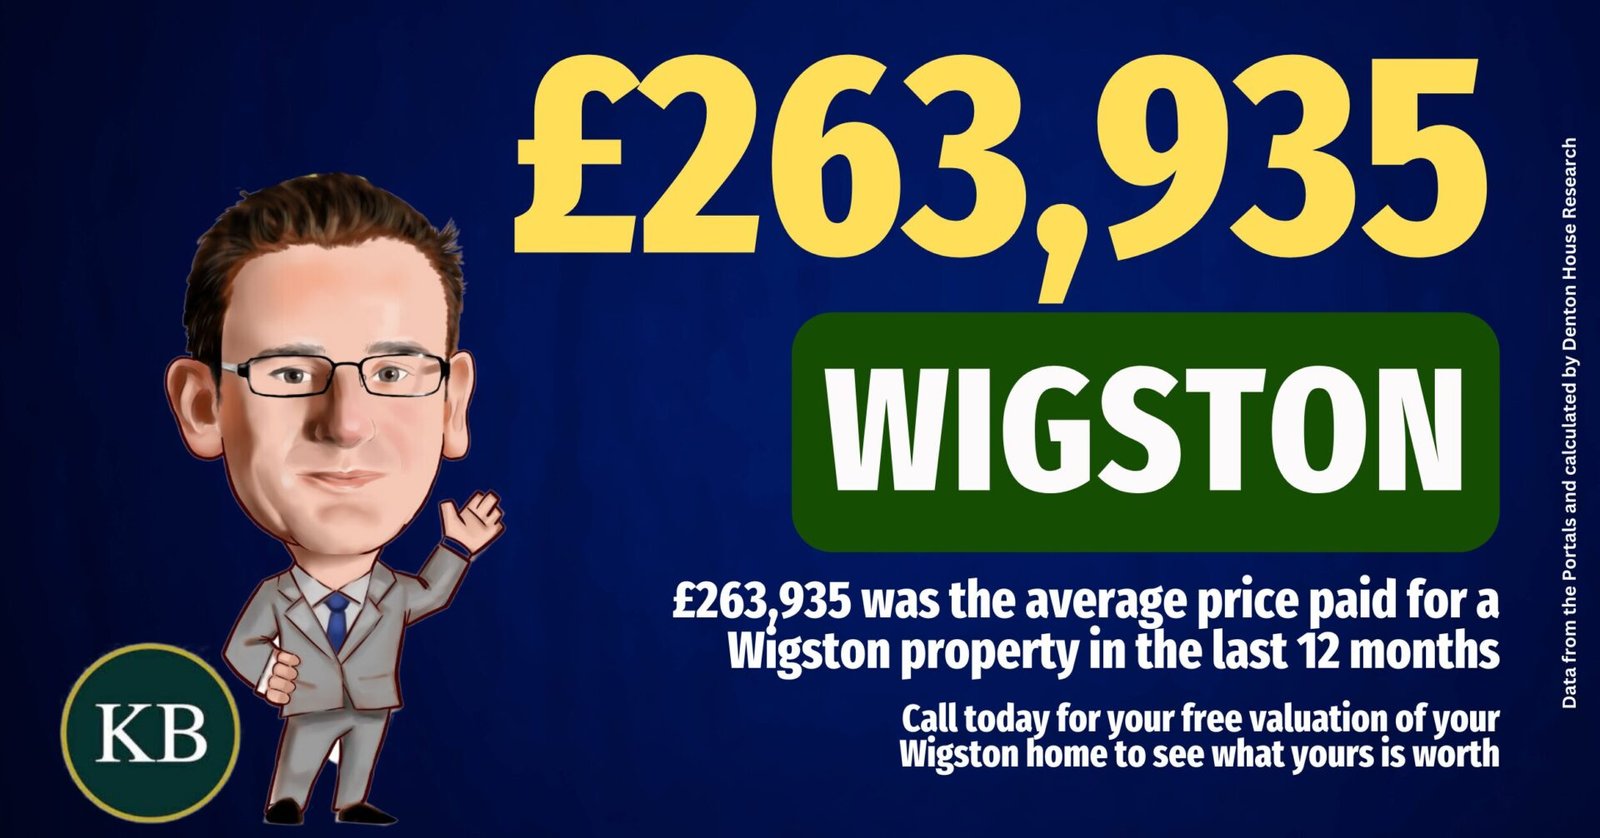
The property market in Wigston (LE18) has shown strong activity in March 2025, with 72 new properties coming to market and 54 being sold subject to contract. While 34 properties saw price changes, 23 were withdrawn from the market. The average price per square foot stands at £316. When comparing 2024 to 2025, trends show a healthy level of new instructions and sales agreed, with a slight uptick in withdrawn listings and price adjustments, suggesting a dynamic and responsive local market. The average price paid in the last 12 months for the Wigston area was £263,935.
All information is accurate at the time of publication and is sourced from TwentyEA. Please note, this data reflects all property transactions within the specified postcodes and is not limited to transactions handled by Knightsbridge Estate Agents