The UK Property Market Update for Week 21 of 2025
 Listings (New Properties on the Market)
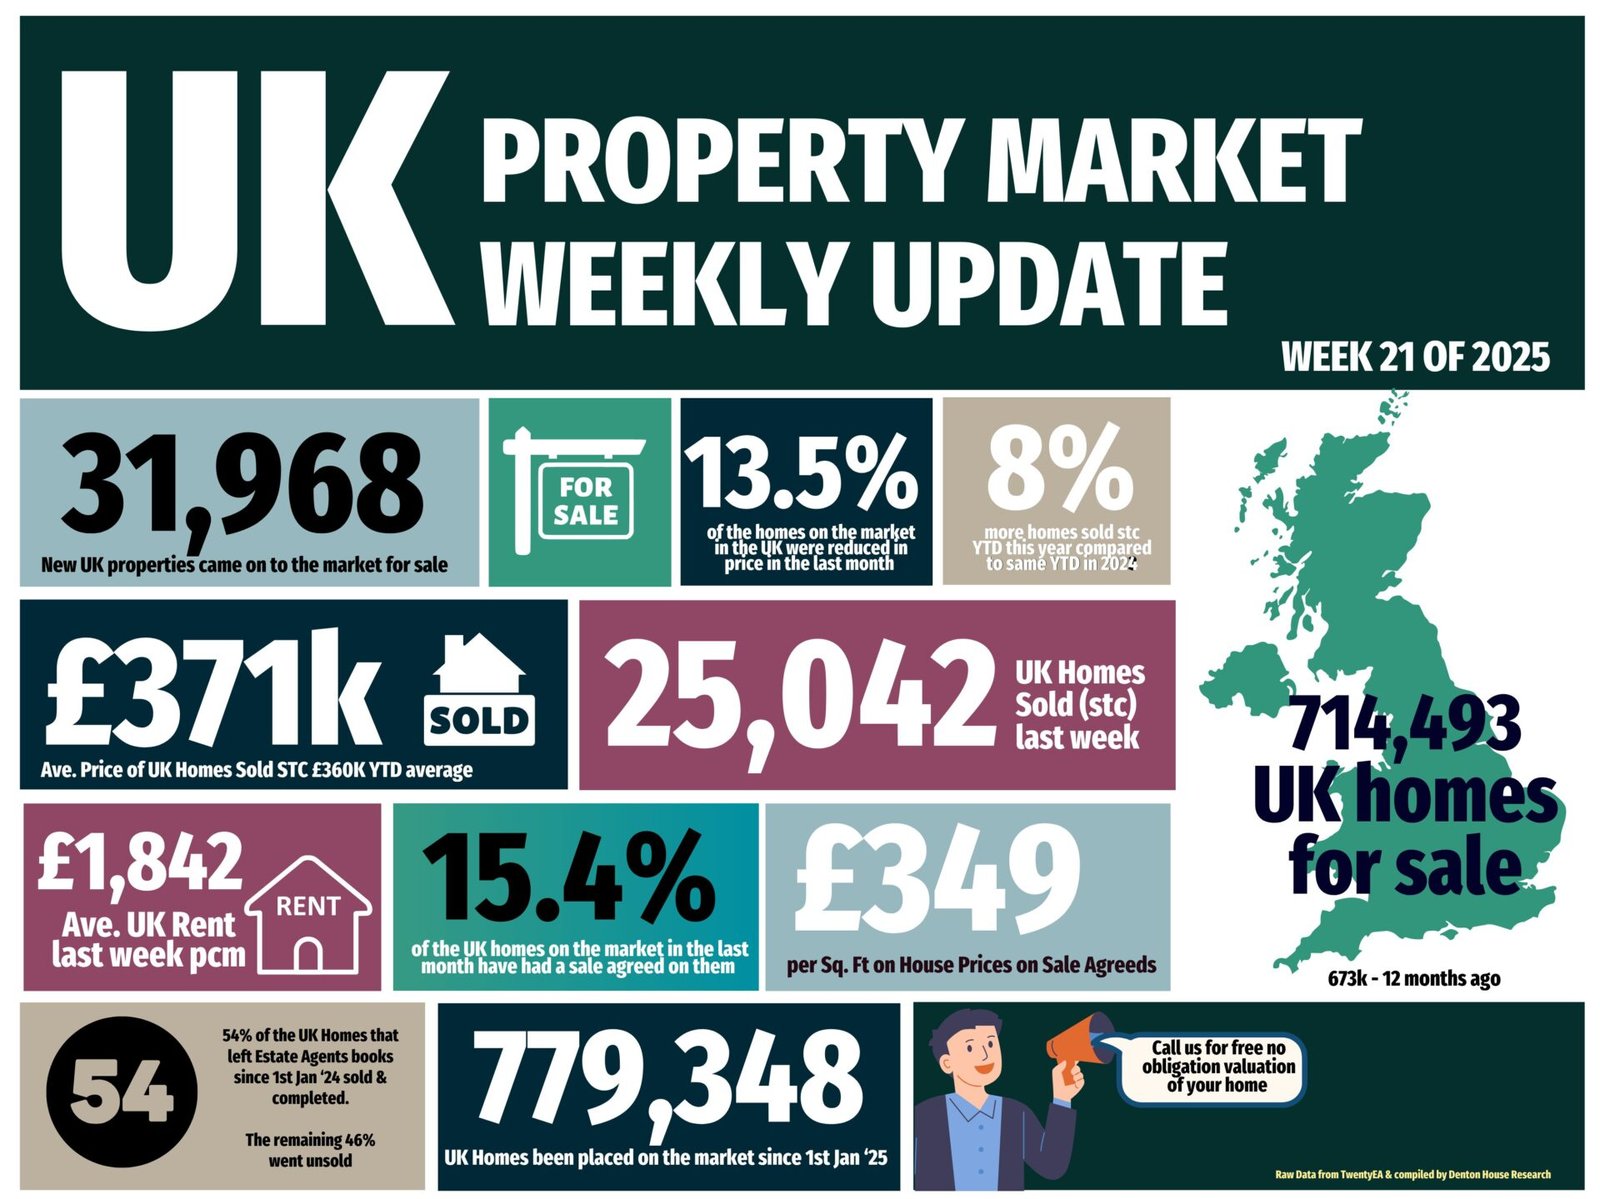
31.9k new listings this week (last week 41.3k)
YTD 5% higher than Week 21 of 2024 YTD and 9% higher YTD compared to 2017/18/19.
Price Reductions (% of Resi Stock)
21.5k Price Reductions this week (last week 27.2k)
Monthly Run Rate in reductions – 1 in 7.5 of Resi Sales stock per month is being reduced (which represents 13.4%).
For comparison, 12.1% average in 2024, though the long-term 5-year average is 10.6%.
Total Gross Sales (Agreed Sales)
25k UK homes sold STC this week (last week 28.9k)
YTD – The number of Sold STC Resi homes are 8% higher compared to 2024 (551k Sales agreed YTD 2025 vs 511k YTD 2024) and 16% higher than 2017/18/19 YTD levels (399k).
Sell-Through Rate (Monthly in Arrears)
April’s sale run rate of 15.36% of Resi stock sold stc (ie 15.36% of Estate Agents properties on the market went sale agreed).
May’s figures not out yet – so will be next week
March’s was 16.3%. 2024 monthly average: 15.3%. Long-term 8-year average: 17.9%.
Sale Fall-Throughs
5,441 Sale fall-thrus last week from Resi Sale Sales Pipeline of 453k UK homes sale agreed (sold stc).
Another method is that week’s sale fall thrus as a % of gross sales that week. This week, that is 21.7% (last week 22.9%). That is below the 7-year average of 24.2%, and well below the 40%+ levels post-Truss Budget (Autumn 2022).
May’s figure not out yet – April, as a whole, 5.51% of sales in the UK agents pipelines fell thru. For comparison, 2024 average: 5.36%.
Net Sales (Gross sales for the week less Sale Fall Thrus for the week)
19.6k net sales this week (22.2k last week), compared 2025 weekly average of 20k.
2025 YTD is 5% higher than compared to 2024 YTD and 11.2% higher than YTD 2017/18/19
If you would like to chat about our local property market, feel free to drop us a line on 0116 274 5544 or email us on clarendonpark@knightsbridge-estates.co.uk.